
It has become something of a recurring theme that whenever we ask our students: “What is the topic in Macroeconomics you fear most?”, the reply is usually “forex (short-form for: foreign exchange)”.
When pressed further on what the problem might be, half of them will invariably say: “Everything!”.
We admit – the topic on foreign exchange is not easy to grasp. But we can show you that with 4 awesome hacks, the foreign exchange topic becomes much easier to understand!
Hack 1: Know your objects of study – which is the domestic/foreign country?
Before we get our hands dirty answering exam questions for forex, we must first identify which is the domestic currency, and which is the foreign currency.
This is an easy step, except many students forget this step in their haste to answer the exam questions. But in fact:
To win big, we have to begin by making small wins.
We can never emphasise enough how this simple mentality will aid you enormously in this topic, or even your studies and life in general.
For the purpose of today’s discussion, let’s set Singapore as the domestic country (SGD), and Malaysia as the foreign country here.
Hack 2: Label the forex graph well.
Like most topics in Economics, the theory of forex is underpinned by graphs, which in this case is the forex market graph.
In the context of the graph, the following labels should always be included in this order:
- The graph (what is this graph?)
- The axes (which variable are you plotting against which?)
- The lines/curves (what is the relationship between these variables for the given phenomenon?)
Always draw graphs with the above in mind!
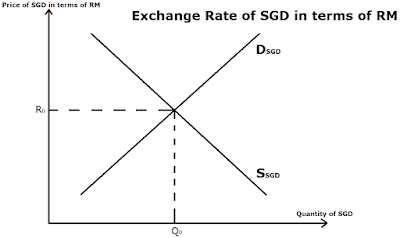
For the forex graph, the labels should accordingly be:
- Graph: Exchange Rate of SGD in terms of RM.
- Axes: y-axis – Price of SGD in terms of RM, x-axis – Quantity of SGD
- Lines/Curves: DSGD (Demand of SGD), SSGD (Supply of SGD)
With the above information, we are therefore drawing a graph to find out the Exchange Rate of SGD in terms of RM. And, we intend to determine the Price of SGD in terms of RM and the Quantity of SGD, by drawing the DSGD and SSGD.

We can then draw the graph as planned above:
Hack 3: Know your Dd and Ss curves well – who is driving which curve?
This is another confusing part of the forex graph.
For example, when Singaporeans decide to stop visiting Malaysia, what is the impact to the exchange rate of SGD? Take a pause to think about it, and when you are ready with the answer, read on!

Did you say “the supply of SGD will increase, because Singaporeans are keeping their SGD”?
If so, you are wrong! In fact the supply of SGD will decrease in the forex market (good job if you had gotten this right).
Did you see the bolded words above? That is the key term in the forex analysis.
In other words, money that is not in the forex market, will not be included in the forex graph.
Money in the forex market is the currency that people intend to exchange into, or out from.
In our forex analysis here, the supply of SGD refers to people putting their SGD up for sale in the forex market, and the demand of SGD refers to people wishing to buy SGD (using RM to pay).
Because:
- Purchasing Singaporean goods and services requires SGD for the transaction, and
- Local Singaporeans are assumed to hold SGD by default (obviously),
We can deduce that:
- The Demand of SGD is driven by foreigners who intend to purchase Singaporean goods and services.
- The Supply of SGD is driven by locals who intend to purchase Malaysian goods and services.
Therefore, in our scenario above, Singaporeans reducing trips to Malaysia reduces the supply of SGD because they now put less SGD up to the forex market.
Hack 4: Always study the impact to the forex market for BOTH curves.
When analysing the impact of an event on the forex market, always study the impact on both locals and foreigners (i.e. both demand and supply curve).
This is because, in most cases, the impact can be on both agents.
For example, an increase in Singapore’s interest rate will cause the supply of SGD to fall (locals hold SGD to earn higher bank interests), and the demand of SGD to rise (Malaysians switch from RM to SGD to earn higher bank interests).
It is also noteworthy that whenever such a scenario happens, at no time should the curve movements contradict (i.e. cause the individual impact to the exchange rate should always occur in the same direction).
Therefore, should you conclude such case where:
- Supply increases and demand increases, or
- Supply decreases and demand decreases,
You most probably have made an error in your analysis and should retrace your steps lest you lose precious marks to the examiner!

And that’s it from us today!
Lend your support!
I hope that you have enjoyed reading this article of mine. I am giving my time to sharing my knowledge and every bit of support means a lot to me!
If you have found these hacks useful, why not share this article on social media, or leave a comment here and let me know your thoughts?
To find out more about my services as a JC Economics tutor, visit my website here.


Hi there, I enjoy reading through your article. I like to
write a little comment to support you.
LikeLike
Thank you for sharing this insightful and well-written blog post. The information you presented was supported by credible sources, and I appreciated the balanced approach you took in presenting different perspectives. To delve deeper into this subject, click here.
LikeLike