
Students know inflation as the scourge where the general price level of the economy increases over a period of time. In fact, its relative importance as a concept is such that most schools in Singapore teach “inflation” as a topic by itself.
Yet for all the long and dreary notes circulated to students about inflation, it surprised me that not many students can confidently explain how the Consumer Price Index (CPI) is derived, and consequently, how the inflation rate is calculated.
Anyhow, the point behind this article isn’t to speculate why, but to shade light on the CPI and why it is central in fully grasping the inflation rate.
This is not just because it is an examinable topic in the “A” levels, but also because understanding how the CPI is derived will help in understanding inflation rate figures more meaningfully.
Our Consumption Pattern
It goes without saying that:
- The impact of price changes differ across different types of goods and services; and
- Each of us have differing consumption patterns.
For example, I do not own a car. So the movements in COE prices are of no interest to me, and more importantly, have no direct impact to my well-being.
If you do not know what is COE, and how it works for buying cars in Singapore, check out this Wiki article for a decent explanation.
On the other hand, I know others who intend to purchase their own car(s), and are obviously impacted by the COE price movements.
My point for the above, is to illustrate that the term “General Price Level”, masks the fact that this aggregated value necessarily depends on these highly-constraining assumptions:
- The General Price Level must be able to represent the prices for all relevant goods and services.
- The General Price Level must also account for and represent all consumers in the economy.
Obviously this is no mean feat, and a big ask for a single number. And yet, this is the function of the General Price Level: To allow a summarised and meaningful evaluation of price changes in general, over time.
Price Indexation
I personally love eating lor mee – that steaming bowl of braised goodness with a dash of garlic and vinegar!

Over the years, I had noticed that the price of a bowl of lor mee had been increasing.
If I had to communicate the increase in prices meaningfully, I would express the price changes in absolute terms, and in relative terms.
In my not-so-distant past, a bowl of lor mee could be bought at $1.50. Today, that same bowl of braised goodness is usually sold at $3 – an increase in price of $1.50, representing a 100% increase in price.
On the other hand, my parents’ generation would recall a time when that bowl of lor mee could be purchased at $0.50 – a difference of $2.50, representing a whopping 600% increase in price. And my grandparents’ could recall a time when….
Well, you should get the picture now. Talking about price changes is only meaningful when we have agreed on a reference point.
In Singapore, the current base year, which refers to the reference point in time for the CPI, is 2014, and is renewed every 5 years. So 2020 will likely be the new base year for the next 5 years.
We are most familiar with interpreting relative changes in terms of percentage change. The CPI is no different, and the base year price is usually expressed as 100 (or 1 in some cases).
When comparing current year price against the base year price, the current year price is first converted as an indexed figure:
Current Year Price Index = Current Year Price / Base Year Price * 100
This method of comparison is known as indexation, which allows the prices to be compared against the reference (base year) price in relative terms easily.
The Weighted Basket
The General Price Level is an aggregated figure representing the prices of all relevant goods and services across the economy.
Just taking a simple average of all such prices won’t cut it though. This is because price movements for certain goods or services matter more to the representative person than others.
But wait, who exactly is this representative person?
To solve this question, a representative expenditure pattern can be estimated by surveying the selected sample population. The expenditure pattern used for reference in Singapore is taken from the 2012/13 Household Expenditure Survey, which you can read here.
The expenditure pattern maps the proportion of expenditure spent on each selected category of good or service. Since a higher proportion of expenditure will mean a higher impact to the representative person’s pocket for a given price increase, the expenditure pattern can also be used to create a weighted average price.
The weighted average price is derived by first assigning weights to each category of goods and services, based on the expenditure pattern. The sum of these weighted prices then forms the weighted CPI basket of goods and services.
The 2019 (and 2014) weighted CPI basket for Singapore is as below (courtesy of the awesome Singstat site):
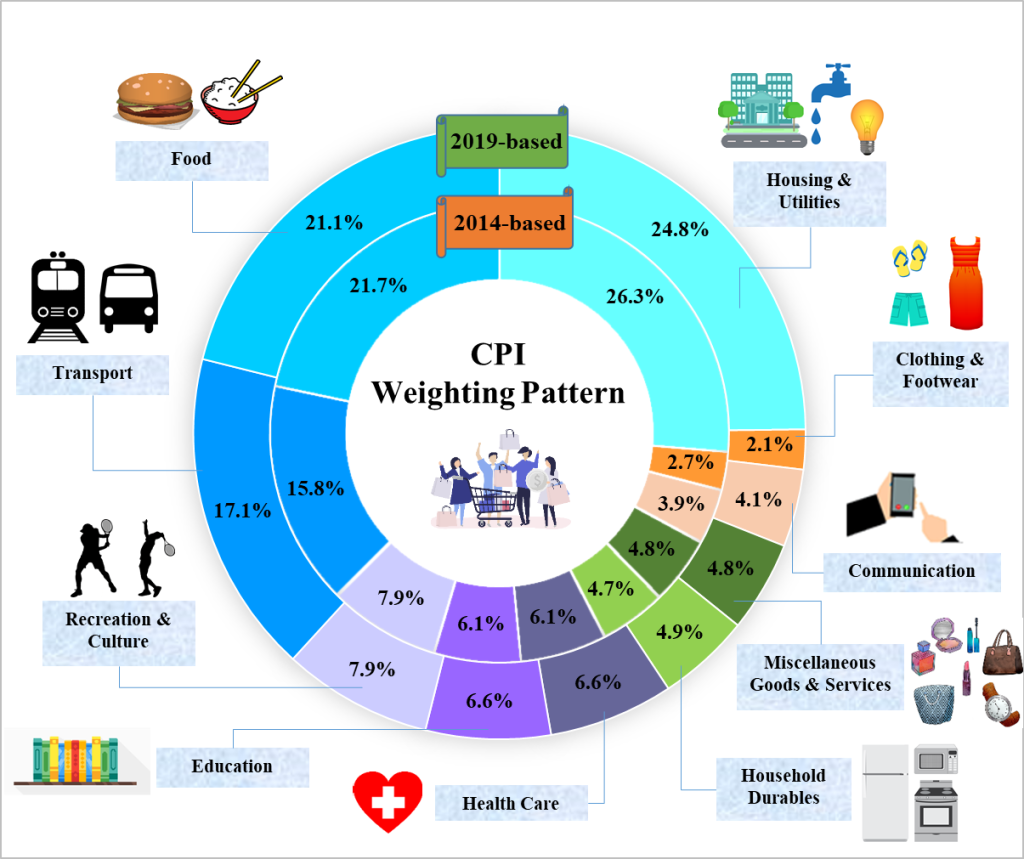
This is probably not surprising to you, but based on the weighted basket above, “housing and utilities”, “food” and “transport”, form the bulk of the expenditure for the representative household in Singapore.
To see how the weights determine the various categories’ contribution of price changes to the average price, take for example, a 50% increase in the price of transport (17.1% weight in 2019), versus a 50% increase in the price of clothing and footwear (2.1% weight in 2019).
When we calculate the final impact to the general price level, the 50% increase in the price of transport translates to a 8.55% increase in general price, while the similarly proportioned increase in the price of clothing and footwear translates to only a 1.05% increase in general price.
Clearly we feel the pain of price changes differently for the various types of goods and services!
Putting the CPI together
And, we now have the building blocks for the CPI.
The base year price index for every category of goods and services in the weighted basket, is by definition, set at 100%.
For the current year CPI, which we are interested in, we now index the current year price for all of these categories, against the base year price, and then multiply each by their respective weights in the representative basket of goods and services.
Finally, we sum the weighted current year price indices to derive the CPI of the current year.
Now that you understand how CPI is derived, have a look at the released 2019 CPI figures for Singapore and the corresponding indices for each category of goods and services. If you have questions, feel free to ask them in the comments section below.
But before I end this article, there are still some matters to point out…
Complete representation at the macro level is impossible.
Long before “fake news” became a fashionable topic, Economists and their numbers formed suspicious characters. In the context of the CPI and inflation rates (which is the rate of change of CPI across time), it is not uncommon to hear laymen saying “these numbers do not represent the ground situation”.
It is not hard to see why. Firstly, it is obvious that the “representative” basket of goods and services are seldom (in fact, likely never) representative of any one person.
The problem gets especially worse when the cross-section of the population to be represented increases. Attempting to represent economy-wide, is more difficult than representing for your district, which in turn is more difficult than for your household, and in turn, for yourself.
For those of my generation, this is analogous to how Devastator is incredibly dim-witted when the Constructions combine!

One way to mitigate this issue is to have a separate CPI statistic for each group of households. A typical inflation report from Singstat states the CPI for the low, middle and high income group for this reason.
In the end though, it is a never-ending balancing act between having suitable macro-scale numbers for economic policies (which tend to be broad-based by nature), and micro-scale numbers for understanding the pluralistic situation amongst us.
The second reason why laymen often state that “these numbers do not represent the ground situation”, is that expenditure is often discrete (i.e. spending in spurts) rather than continuous.
The most obvious example to illustrate this problem in Singapore’s CPI is in the healthcare expenditure, which represents only 6.1% of total expenditure in 2019. In fact, I can almost hear howls from the background saying “That can’t be right!” already.
This cynicism is not entirely unfounded. Healthcare costs are indeed high, and soaring in Singapore. Yet, for all the outcries, healthcare expenditure is assigned a much lower weight than what we would expect.
To see why, we need to understand that cost estimation across a period of time, is a function of the probability of spending, and the spending per instance.
Healthcare expenditure, in particular, represents an extreme scenario, in that for most of us, the probability of having to spend on extremely expensive treatment is very low. As a result, the expected spending on healthcare is low across the households, creating what appears to be an “unbelievably” low aggregated spending proportion.
Again, you could sub-divide the households accordingly and calculate their CPIs based on their respective expenditure patterns. Typically, the decision on how these divisions are to be made depends on how you would like to target your economic policies.
While there are such targeted policies here and there, we need to bear in mind that creating multitudes of different targeted policies are expensive to create, maintain and communicate. Also, having too many policies may risk incoherence in the macro-policy theme.
Such is the job of our policymakers – I honestly do not begrudge their “high” salaries. You can hear some of our deputy prime minister’s off-the-cuff rantings here.

Price changes can be seasonal.
This is especially true for fresh produce.
If the period of study is year-on-year, seasonal effects would not matter as much. But for purpose of short or medium-term reporting, inflation can be reported in periods of less than a year (such as half-yearly or quarterly).
In such cases, to eliminate seasonal price changes from interfering with “actual” inflation, CPI comparisons should be made between similar periods in previous years, rather than between adjacent periods.
This is the reason why in the inflation report from Singstat, the price changes for each half-yearly period in 2019 is derived by comparing the current-period CPI against similar periods in 2018.
Support Me
I write because I am compelled to share what I know, and what I have learnt in turn, from the community.
If you liked reading this article, why not support me by sharing it with your friends, and/or subscribe to my articles to get them hot from the oven!
To those who have subscribed to my articles, I am greatly humbled by your support. People like you are a great source of motivation for me to write more, and better.


I blog often and I really appreciate your content. This article has truly peaked my interest. I’m going to take a note of your blog and keep checking for new information about once per week. I opted in for your RSS feed too.
LikeLike
It’s hard to come by educated people for this topic, however, you sound like you know what you’re talking about! Thanks
LikeLike
What’s up, this weekend is good for me, for the reason that this moment iam reading this great educational paragraph here at my residence.
LikeLike
Thank you for writing such an excellent article. It helped me a lot and I love the topic.
LikeLike
Thanks for writing this article
LikeLike
Good way of telling, and pleasant piece of writing totake information about my presentation topic, which i am going to deliver in university.
LikeLike