
For most part, direct taxes and direct subsidies do not typically appear in the “IB” and “A Level” Economics examination.
However, there remains the oft-chance that these concepts are tested, and it is important for students to understand how these policies work and how they are illustrated by the demand-supply diagram.
Direct Subsidy
Unlike the usual indirect subsidy, a direct subsidy is characterised by the subsidy being disbursed to consumers, rather than to producers.
Examples of direct subsidies include government-issued vouchers that can be redeemed by the consumer when purchasing goods and services.

Rather than shifting the supply curve downwards, as in the case of indirect subsidy, the demand curve shifts up by the direct subsidy amount instead, demonstrating the higher willingess and ability of consumers in purchasing the good:
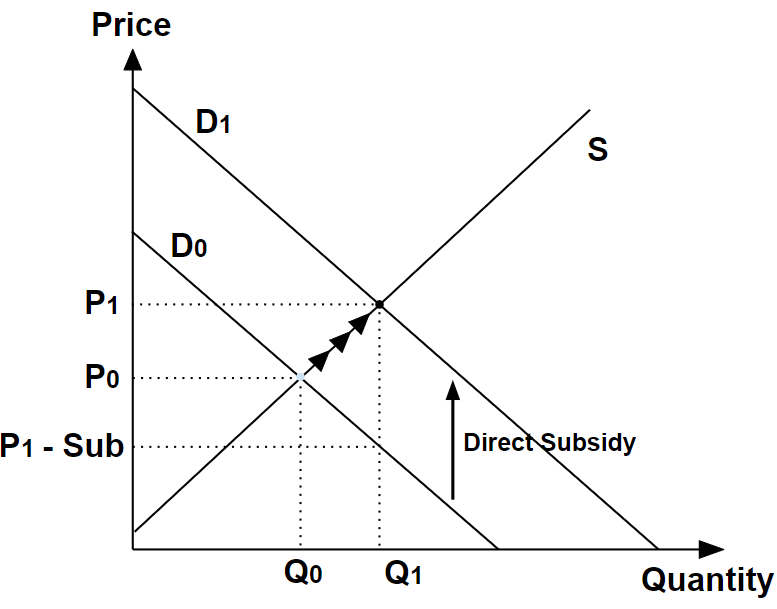
A slightly confusing aspect to the illustration of the direct subsidy lies with the increase in market price from P0 to P1. Many students have asked me if there was something wrong as they expect the market price to fall with a subsidy instead.
In fact, the consumer indeed experiences a lower “out-of-pocket” price, because they utilise the subsidy upon making the purchase at P1, and therefore pay the equivalent of P1 – Sub < P0.
So the direct subsidy does increase affordability of the good to consumers, like in the case of the indirect subsidy.
We can also derive the subsidy incidence, which is the amount of subsidy enjoyed by consumers and producers respectively, from the diagram:
- Producers: P1 – P0
- Consumers: Sub – (P1 – P0) or P0 – (P1 – Sub)
Generally for a direct subsidy, the price elasticity of supply determines the share of subsidy enjoyed between producers and consumers: The more price elastic the supply, the more the subsidy share will go to consumers.
Direct Tax
Similar in concept to the direct subsidy, a direct tax is characterised by the tax being levied on consumers, rather than on producers.
Examples of direct tax include the almost-universally disliked GST (Goods and Services Tax), and the Additional Buyer’s Stamp Duty (ABSD) levied on residential properties.
Opposite to the case of a direct subsidy, the demand curve shifts down by the direct tax amount instead, demonstrating the lower willingess and ability of consumers in purchasing the good:
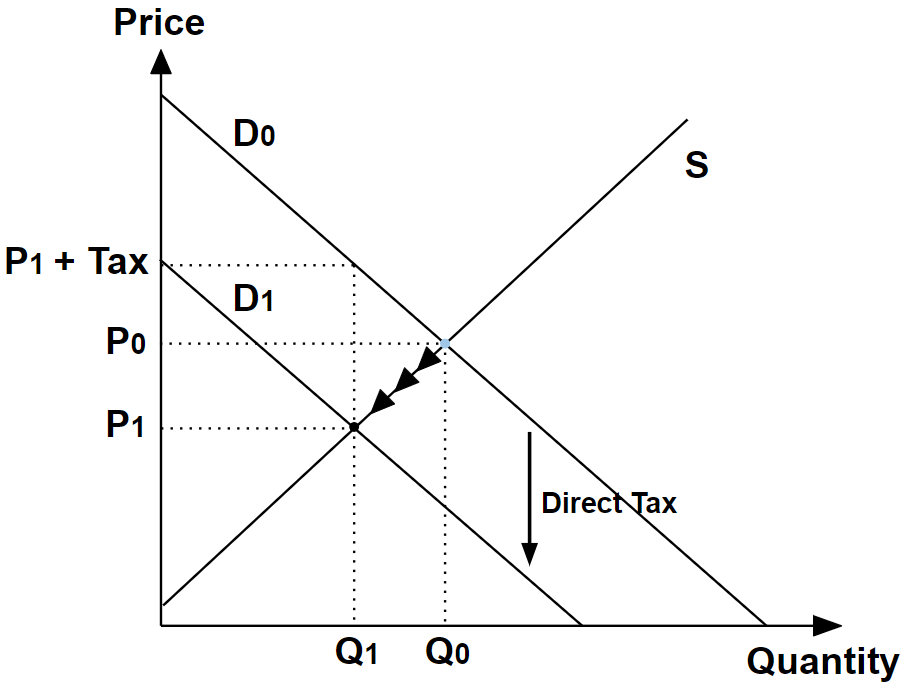
Notice that a direct tax causes a decrease in market price from P0 to P1. Again, there is nothing wrong with the diagram, as the situation is different from that of an indirect tax, where we expect the market price to increase.
In fact, the consumer indeed experiences a higher “out-of-pocket” price, because they are taxed upon making the purchase at P1, and therefore pay the equivalent of P1 + Tax > P0.
So the direct tax has the effect of discouraging consumption of the good by forcing consumers to pay more, and bringing the market price down (unlike in the case of an indirect tax).
We can also derive the tax incidence, which is the amount of tax contributed by consumers and producers respectively, from the diagram:
- Producers: P0 – P1
- Consumers: Tax – (P0 – P1) or (P1 + Tax) – P0
Similar to a direct subsidy, the price elasticity of supply determines the share of tax contributed between producers and consumers: The more price elastic the supply, the more the tax contribution will be, by consumers.
Update (2026): The team at JC Econs 101 has collaborated with DeadWeight·Plots to produce a step-by-step animations of the diagrams discussed:
Be sure to check them out!

