
Most of us have heard of the GINI coefficient – it is commonly utilised in measuring the level of income inequality in a country, and ranges from 0 – 1 (or 0 – 100% depending on how it is used).
But many students were not taught how the GINI coefficient is calculated, which is a pity, because not only is the methodology instructive, but also elegant and easily illustrated and understood.
Introducing the Lorenz Curve
In 1905, Max Lorenz developed a graphical representation of wealth distribution in a population. That representation came to be known as the Lorenz Curve.
In this graphical representation, the cumulative share of population income is plotted against the associated cumulative share of population.
In an equal society, where the wealth is distributed equally amongst the population, the cumulative share of population income should always equal the respective cumulative share of income.
For example, 10% of the population should receive 10% of the population income. 50% of the population should receive 50% of the population income, and so forth.
In a perfectly equal society therefore, the cumulative share of population income is directly proportionate to cumulative share of population, and increases by the same amount. Graphically, this is represented by a 45 degree upward sloping line.
In an unequal society however, the poorer segment of the population receives disproportionately less income, and vice versa for the richer segment.
For example, the poorest 50% of the population could be receiving only 10% of the population income, whereas the richest 10% of the population could be receiving 50% of the population income.
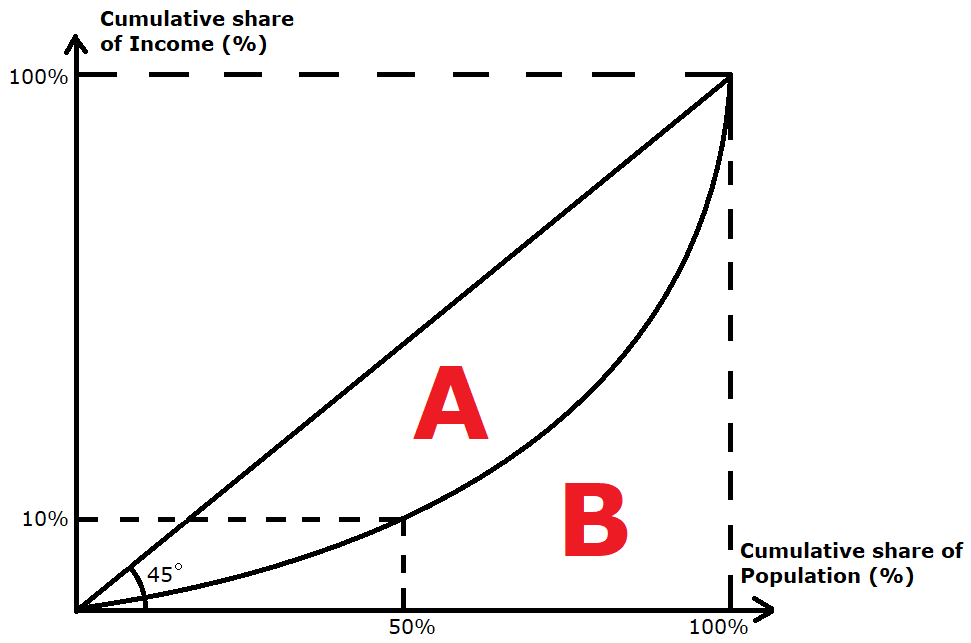
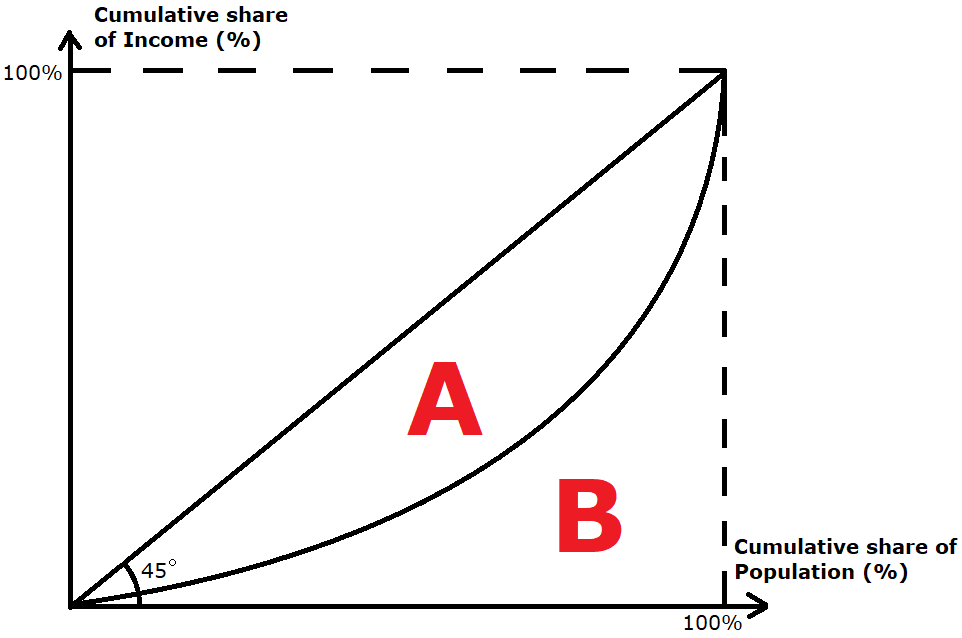
As seen from the graph, this is graphically represented by a convex curve (in this case, an upward sloping curve that increases at an increasing rate. This curve is the Lorenz Curve.
Logic dictates that the Lorenz curve must converge with the ideal line (represented by the 45 degree upward sloping line) at 2 points:
- At the origin, since 0% of the population must be receiving 0% of the population income.
- At the point where cumulative share of income = 100%, since all of the population must be earning the population income, no more or less.
Calculating the GINI Coefficient.
It can be seen graphically that the closer the Lorenz curve is to the ideal line, the more equal the society is. In other words, the smaller the deviation from the ideal line, the more equal the society is.
The GINI coefficient measures the strength of that deviation, and is calcuated as: A / (A + B)
- In a perfectly equal society, the GINI coefficient is “0” because the area A is “0”.
- In a perfectly unequal society, the GINI coefficient is “1” because the area B is “0”.
So therefore the GINI coefficient always ranges between “0” and “1”, with “0” being the most equal, and “1” indicating perfect inequality.
So the next time you read inequality statistics and encounter the GINI Coefficient, you should know better what the numbers actually mean!
Lend your support!
I hope that you have enjoyed reading this article of mine. I am giving my time to sharing my knowledge and every bit of support means a lot to me! Do drop me a comment or share this article on social media with your friends.
To find out more about my services as a JC Economics tutor, visit my website here.