
It is generally rare to have any questions asking specifically about subsidy incidence on consumers and producers in the “A” level Economics paper. Consequently, students are unlikely to see much details in their study materials about such a theoretical depiction.
But then, nobody explicitly forbade such a question either, especially if you happen to be a student in one of the “top-tier” JCs which are notorious in setting tough year-end Prelim papers.
This article therefore explains the impact of subsidies to consumers and producers clearly, and also “solve” a common question amongst students: Why is there a deadweight loss to society when subsidies are essentially “free money” from the government? Where did the money go to?
Pre-Subsidy.
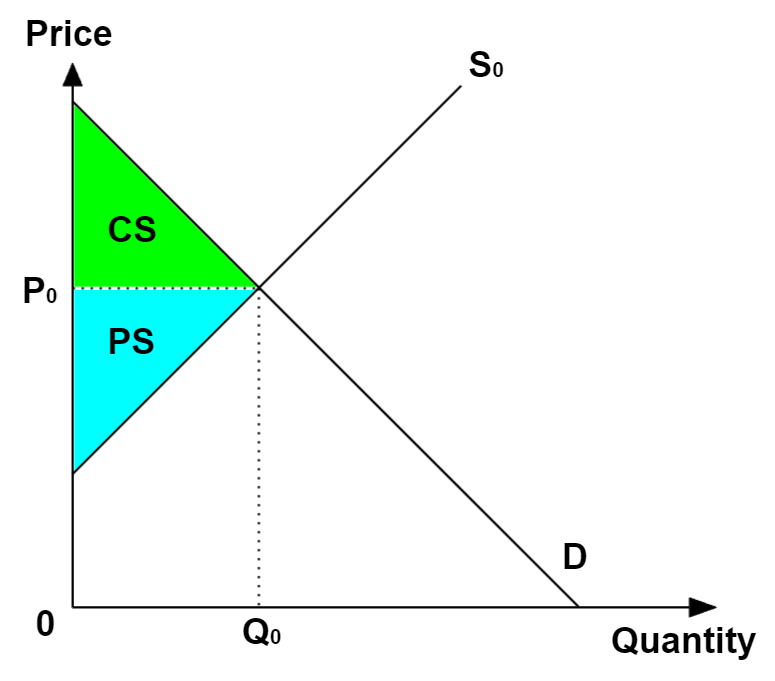
To understand how a subsidy impacts a given market, we first illustrate its equilibrium state of demand and supply, with the Consumers’ Surplus (CS) in green, and the Producers’ Surplus (PS) in blue.
If you are not familiar with the concepts of the respective surplus as depicted above, you may refer to an elaboration on the theory, from my notes.
In short, the CS represents the surplus benefits enjoyed by the consumers after paying for that level of consumption. In turn, the PS represents the surplus revenue (a.k.a profits) earned by the producers after accounting for costs of production.
As you will see shortly, clarity on both concepts will become very important in the subsequent discussion.
Subsidy arrives!
To be more specific, let’s talk about the case of an indirect per-unit subsidy from the government: One where the subsidy is paid to the suppliers. Some of that is then shared with consumers, through a downward-shift of the supply curve (S0 → S0 + Sub).
Students commonly mistake the downward movement of the supply curve to represent a reduction in the suppliers’ costs of production across all output levels. This is incorrect.
To see why, consider that the total subsidy amount paid by the government to the suppliers is determined by the market consumption level multiplied by the per-unit subsidy rate.
In turn, this payout to suppliers will be factored into their output levels accordingly. This is clearly not describing an outright change to the actual costs of production, which remains unchanged.
Accordingly, this means that S0 above, still represents the actual cost of production, whereas S0 + Sub represents the reference against which suppliers will determine output levels post-subsidy.
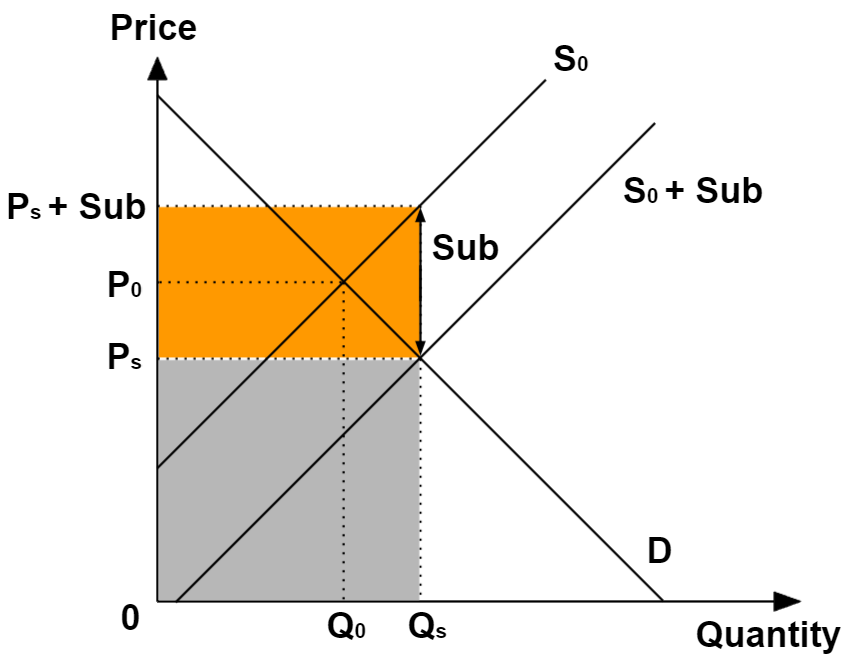
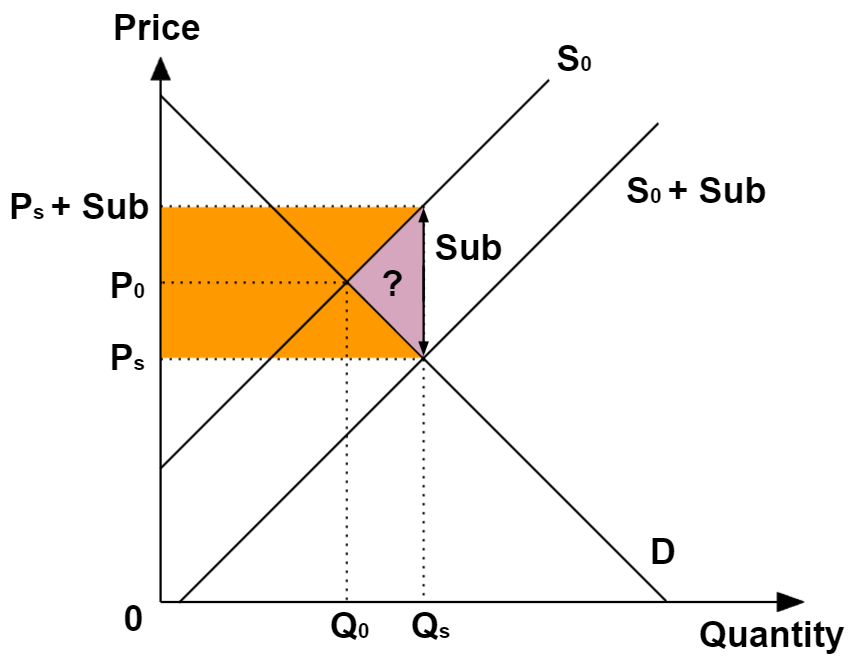
With the subsidy implemented, the market price falls from P0 to Ps and the market output level rises from Q0 to Qs. The consumers’ expenditure is now Ps*Qs (grey area).
Of course, that amount of money goes to suppliers, but in addition. the subsidy paid out to suppliers, Sub*Qs (orange area) must also be included. Thus, the sum of the grey and orange areas represents the total revenue to suppliers.
Some of the subsidy went to consumers.
This is relatively easy to see from the graph.
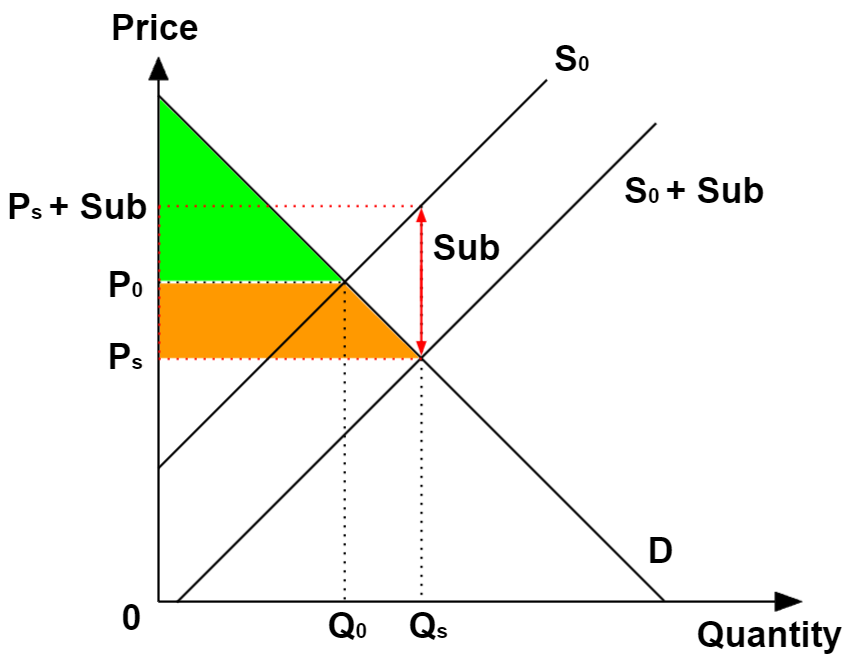
Given the new market price-quantity combination of Ps and Qs, the new CS is now the sum of the original green area, plus the orange area, which is financed from the total subsidy paid out.
Some of the other subsidy went to producers.
Remember what I mentioned earlier about how the actual costs of production experienced by producers remain unchanged post-subsidy?
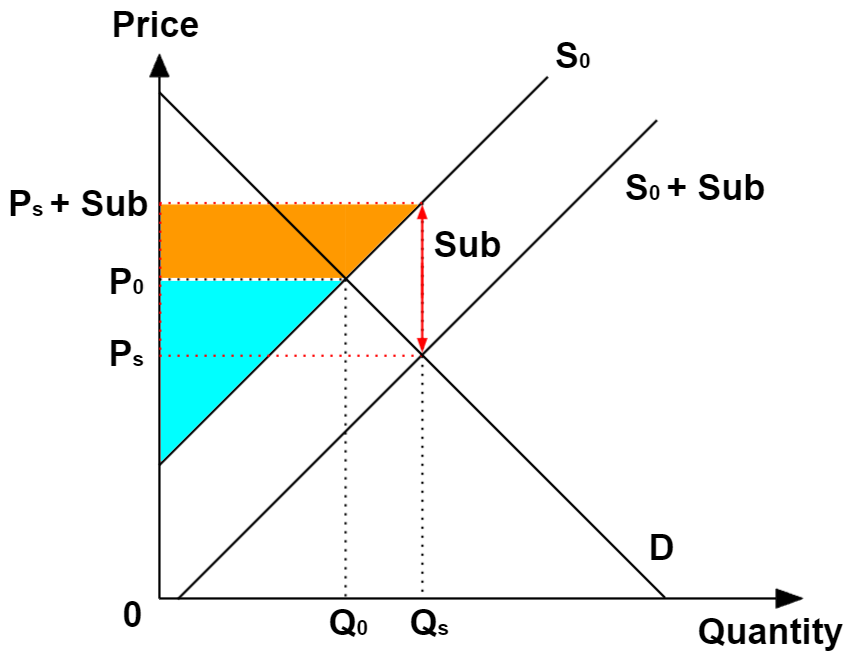
This means that S0 will be utilised in determining the new PS (rather than S0 + Sub), yielding the sum of the original PS (blue area), plus the orange area, which is financed from the total subsidy paid out.
Where did the remaining subsidy go?
Having accounted for the subsidies apportioned to the consumers and suppliers respectively, we find that there is the purple area “unaccounted for” as below.
Most “A” level texts will go on at this point, to label this area as a “deadweight loss”, which is the fancy term for societal welfare loss that all Economics Padawan should know. If you don’t already, read my notes about market failures.
For some students who aren’t satisified with such an answer, this is perplexing because the subsidy is supposedly paid out to the market’s respective participating agents, which are limited only to the consumers and suppliers in the demand-supply model
OMG is there a black market in this “legit” market??
Of course this isn’t the case – a simple sleuthing exercise quite easily reveals that.
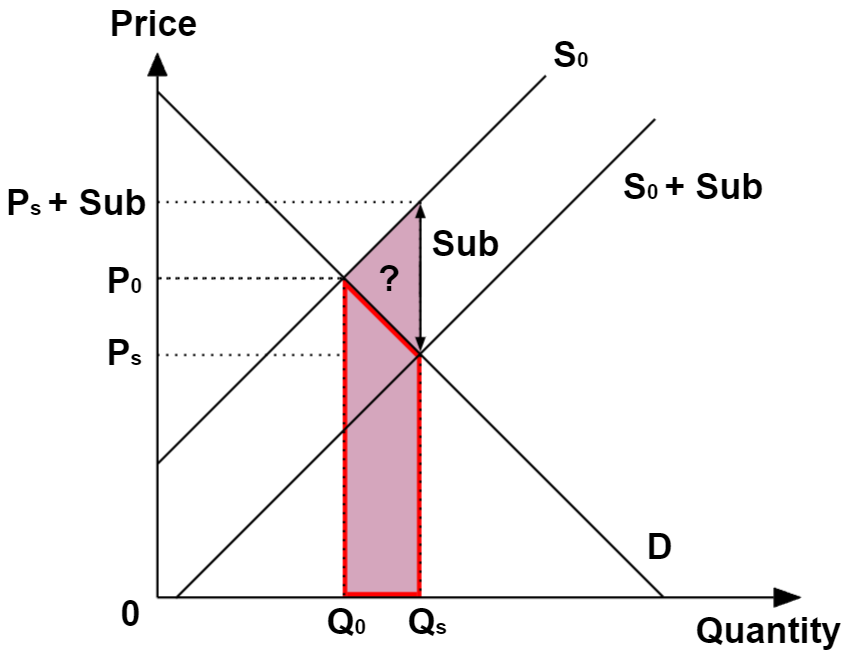
Consider in the above graph, that the presence of subsidy led to an increase in total cost of production borne by society, illustrated by the purple area.
This increase in output has also led to an increase in total benefits enjoyed by society, illustrated by the area bounded in the red lines.
Taking the difference between the additional total costs and total benefits, we find that the stimulation in production due to the subsidy has in fact led to a net increase in cost to society.
Incidentally, this area also represents the subsidy amount unaccounted for earlier. Therefore, we can conclude that:
- A portion of the subsidy goes neither to consumers and producers, but is used to “pay-off” the net increase in cost to society instead; and
- Although consumers and producers do not appear to have borne this additional cost, the “lost” subsidy still counts as a deadweight loss because it is funded with tax monies, which is ultimately borne by these same market participants.
Update (2026): The team at JC Econs 101 has also collaborated with DeadWeight·Plots to produce a powerful set of step-by-step animations of the indirect subsidy diagram showing the deadweight loss and impacts to consumers and producers. Be sure to check it out!

Aw, this was an incredibly good post. Finding the time and actual effort to create a top notch article… but what can I say… I procrastinate a whole lot and don’t manage to get anything done.
LikeLike