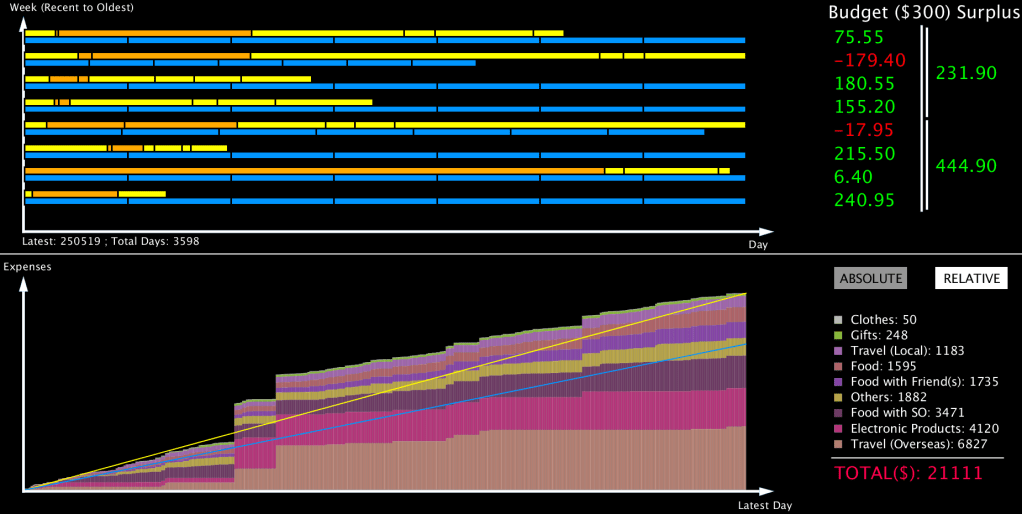
Most people express surprise when I mention that I have been keeping a daily record of my personal expenses for more than a decade now. This almost regimental daily action, started as a personal data dashboard building exercise to practice my new-found software development skills. The idea was to feed continual updated data to a dashboard that synthesises the relevant information to the viewer.
It then occured to me that recording my daily expenses was the perfect fit as a use-case, since the data is updated constantly, structured and actually useful for me when aggregated.
Upon completion of the dashboard, and with several months of data sufficient to demonstrate my newfound coding prowress, I genuinely thought that the daily recording would die a natural death, as with many of our initiatives (think New Year’s Resolutions).
Except it didn’t. I had discovered that the record expenses had become something of a diary – something that I had always said I wanted to do properly, but never got down to. This carries a key insight into many of our lives in Singapore: We have become so reliant on commerce in our daily lives, that the individual’s consumption expenditure can provide meaningful traces to his or her living activities.
Just think about how most of us conveniently ignore that economic resource allocation may be achieved in ways other than through markets or the state.
Similar to how Macroeconomics studies the aggregated Mircoeconomic behaviours, the individuals’ consumption pattern can also be aggregated and tracked at the national level, yielding us insights into national level trends to our consumption.
Conveniently, the Singapore Department of Statistics (DOS) computes the reference consumption pattern for the purpose of measuring price inflation, which we can then use to track how consumption has evolved in Singapore.
A recap on the CPI “basket of goods and services”.
The Consumer Price Index (CPI) aggregates the price levels experienced by consumers to facilitate high-level tracking of the inflation rate over time. The discussion of how the CPI is calculated is an article in itself. For our convenience, it can be summarised in the following steps:
- Survey households on their consumption items and corresponding expenditure amounts;
- Select representative consumption items and categories;
- Normalise the selected item categories’ expenditures against 100;
- Subsequent years’ price changes to the same items and categories are weighed using the weights derived from the normalisation, against 100.
In Singapore, the rebasing of the CPI is done every 5 years, with the current base year being 2024. Rebasing refers to the execution of steps 1-3, deriving the representative basket and resetting the CPI to 100 again.
The purpose of rebasing is to update the basket of goods and services to reflect the latest consumption pattern in Singapore. As you might imagine, the determination of the representative basket is a critical step to ensuring accurate price inflation monitoring.
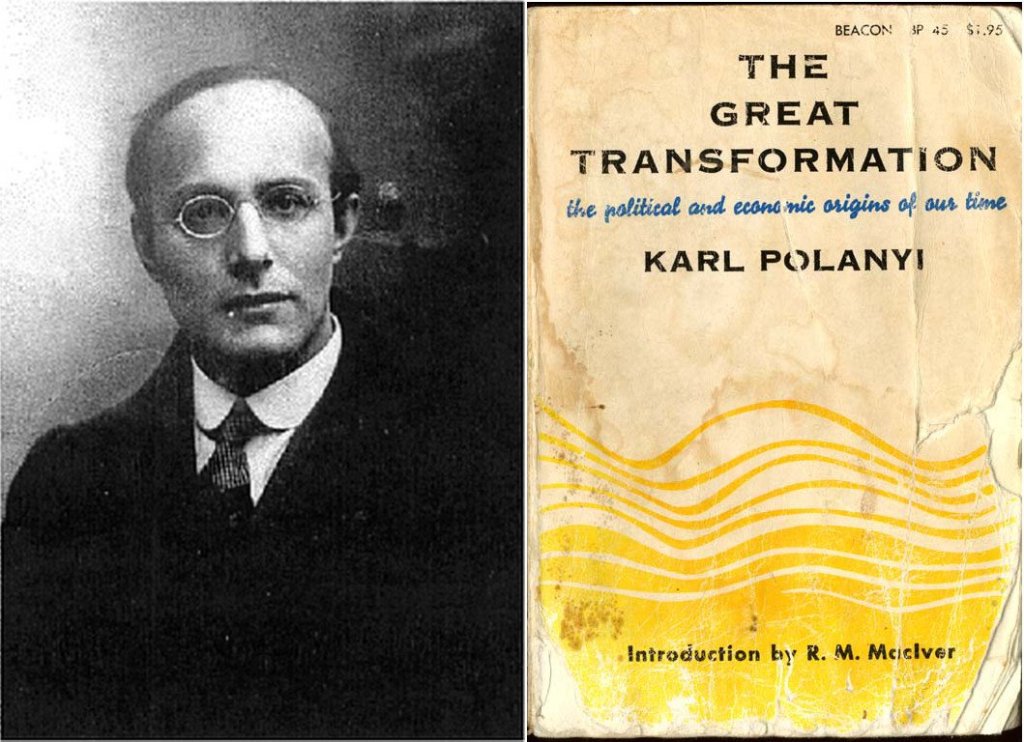
Therefore each rebasing exercise outputs not just the basket, but also a publicly-available report detailing the findings and justifications, which we will reference for our discussion: 2009, 2014, 2019, 2024.
Evolving expenditure patterns.
By comparing the expenditure weights for the same categories across the years, we can see some high-level trends:
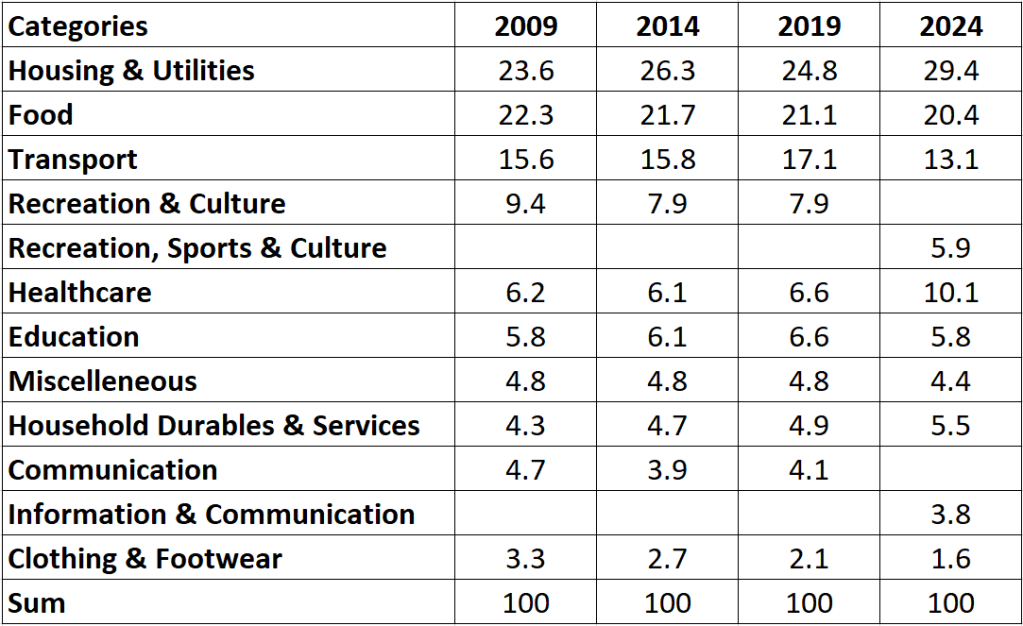
The boundaries of the categories may shift across the years, with the most obvious inferred from the naming of the categories (e.g. “Recreation & Culture” -> “Recreation, Sports & Culture”). To avoid confusion, the table breakdown reflects both old and new categories, but it should be noted that even within categories, there could be changes to the item compositions.
It is also no surprise that the 3 categories, housing & utilities, food, and transport are consistently highest in proportion, at roughly 60-70% of the total expenditure.
Houses got (alot) more expensive recently.
The purchase of a house is not considered to be a consumption item as it is treated as a capital investment, which is accounted for separately. Instead the expenditure on housing is based on actual and imputed rent. The latter refers to the equivalent rent a house-owner pays for the “services rendered by the house” and can be thought of as a proxy to regularised payments to the house.
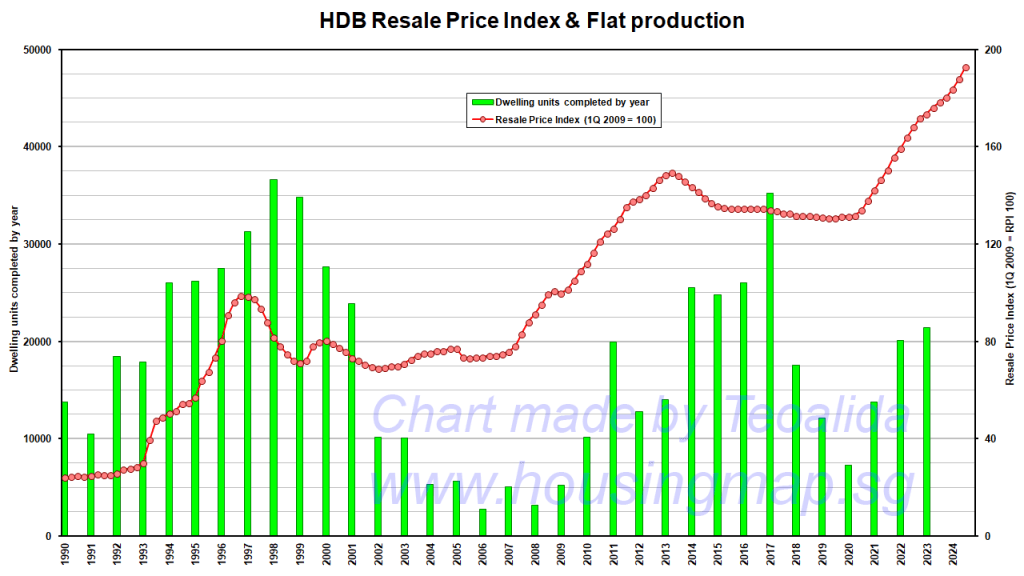
By a large margin, imputed rent accounts for the largest share of expenditure within the “housing and utilities” expenditure category at >70%. A good first guess to the reason behind the dip in expenditure observed in 2019 (from 26.3 to 24.8) followed by a sharp increase in 2024 (29.4) would therefore be house prices in Singapore.
Indeed such price trend was observed, at least for HDB resale flats:
Food and clothing are becoming less important relatively?
Curiously, both “food” and “clothing and footwear” expenditure categories were trending down consistently through the 2000s.
On food expenditure, the rebasing reports always gave the cookie-cutter explanation of “slower rate of increase in the households’ spending on food compared to other expenditure items“. Not exactly a Sherlock Holmes moment there, but it’s marginally better than the lack of mention for clothing expenditure.
On the other hand, the latter trend was not unnoticed by the Straits Times, which posited that overall expenditure had fallen as online shopping and fast-fashion has increased sellers’ competition and shoppers have become more savvy at deal-finding.
It is less clear-cut for food expenditure because the sense that food prices had in fact increased, is backed both anecdotally and from inflation data, especially post-COVID. Eating-out, whose prices have not been trending down, constituted the largest contribution to food expenses and this expendtiture proportion is only growing. And whilst it is true that the food items vary across the rebases to reflect changing food consumption patterns, it cannot in itself explain the observed fall in expenditure proportion of food.
I should state once again that food expenditure weights falling does not necessarily indicate that food expenditure is falling – it is just as likely that it is growing, albeit slower than that of other categories.
COE prices soared but transport expenditure fell.
It was somewhat bizarre seeing how transport expenditure fell proportionately in 2024. Helpfully, the report noted this to be due to “lower total spending on Motor Cars during the period due to the reduction in Certificate of Entitlement (COE) quotas, despite higher Motor Cars prices following the general uptrend in COE premiums and other car-related taxes.”.
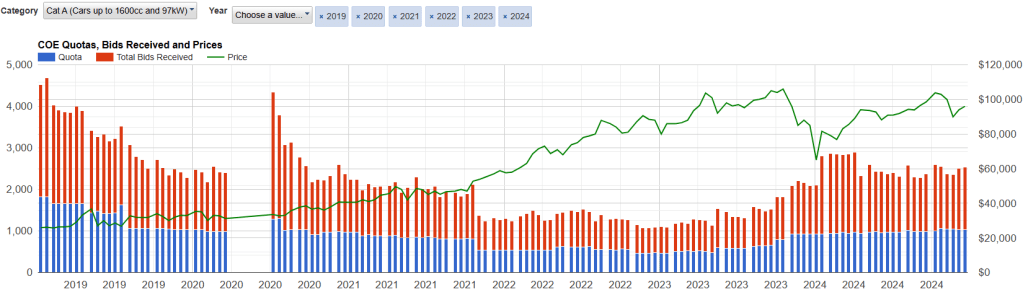
A default assumption I usually make, alongside many Singaporeans I believe, is to attribute COE costs as the single largest expenditure component to transport in Singapore. And that’s not an unreasonable assumption: Upwards of 20% of the total expenditure on transport (air, land or sea) was indeed attributable to COE costs.
However, on closer look, COE expenditure may not be the only major factor. Firstly, the COE trend showed that whilst COE quotas generally fell by a factor of 3 across the various categories, prices increased, peaking by as much as five-fold. Thus even if the overall COE revenue had in fact dropped, it is not likely to be a large drop. In fact, we expect COE expenditure to increase in general.
Secondly, there is the remaining 80% of expenditure to account for:
- There has been an uptick in COE renewals as opposed to purchasing a new vehicle alongside the COE purchased, contributing further to the nearly halving of motor car expenditure between 2019 and 2024.
- Transport expenditure during the COVID period of 2020 and 2021 had drastically fallen, and even today, land transport demand appears to be reduced, possibly due to work-from-home policies.
- Air travel, which contributes ~10% of travel expenditure, was severely disrupted by COVID, and flight capacities have not fully recovered even now.
Health expenditure exploded post-COVID.
Most Singaporeans would by now be used to the rhetoric of expecting higher healthcare costs, so higher health expenditure isn’t anything new. Still it is difficult to forsee the weight of health cost going from roughly 6% to a staggering 10% almost suddenly with the 2024 rebasing.
What could have caused the sudden increase in expenditure proportion? Referring to the breakdown for the 2019 and 2024 CPI baskets:
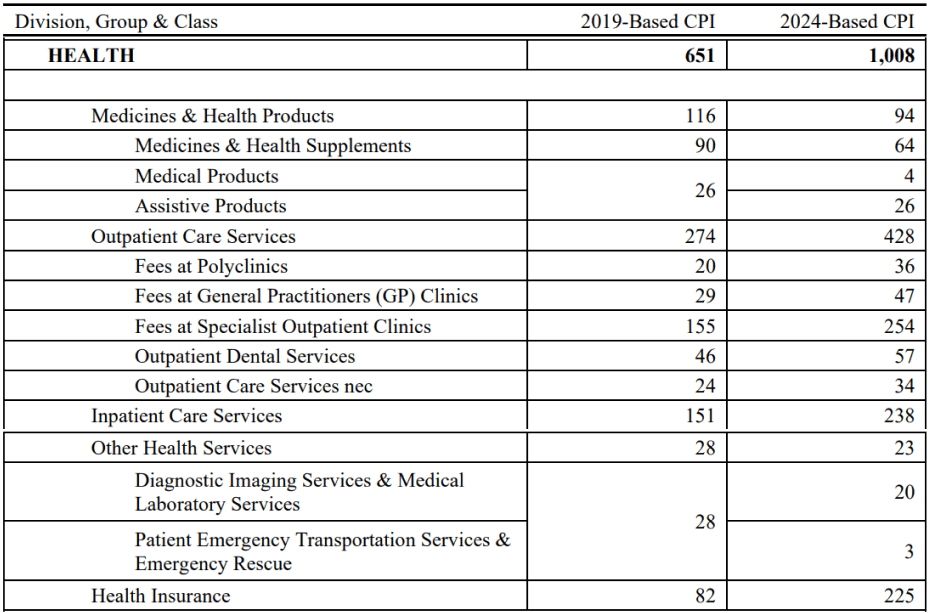
Intriguingly, the increase to expenditure is recorded almost uniformly across the inpatient and outpatient care categories. And perhaps not surprisingly, given how insurance premiums track expected payouts, the health insurance expenditure recorded an increase too, albeit by a much larger factor of nearly 3.
Unfortunately I hadn’t been able to find much about it with the cursory searches I am doing for this article. Perhaps it will be covered in another article if I do find something about it. And if you, the reader, knows something about it, please share them as comments below!
More to be discussed.
In Part 2, we will look at the evolution to the composition of the items selected to represent the typical Singaporean’s consumption. Are Khong Guan biscuits still a thing? Do people still subscribe to cable TV? These, and more will be discussed in the next article about how consumption patterns evolved in Singapore.

