
2 years ago, I had done an “exam-ready” write-up on the proof behind the claim that the Theory of Comparative Advantage confers potential mutual benefits between trade partners.
The motivation was straightforward – a key struggle amongst students had been the reproduction of similarly detailed explanations that the “A” level exam requires. And so I often found myself having to expend significant effort in explaining the theory proper.
Unfortunately, there is no “fixed” set of numbers and explanation that schools teach to their students, and thus much time is spent attempting to decipher all manners of numbers with broad ranges of decimal funk.
To help my students (and myself), I prepared a set of numbers and a detailed explanation in that article to use in my lessons, and also share to the broader audience (non-rivalry ftw).
And it worked! At least for the year 2019.
The oops moment.
COVID arrived then, and last year’s students were not required to study this topic for the exam. So the next time I utilised my previous work was…about now. Cue the point of time in the year that JC2 students would be learning about this topic (and getting confused).
The hallmark of good documentation is to achieve a high level of comprehension for first-time readers.
Therefore it was mildly embarrassing for myself, when I was not able to explain the graph to a student, that yours truly had himself drawn for the write-up previously:
The good news was that the graph is ancillary – that is the reproduction of that graph is not expected for the exam. But then that begs the point of illustrating that graph in my explanation to begin with.
So this article is meant to update and make even clearer, the graphical representation used in explaining the previous explanation.
First, the context.
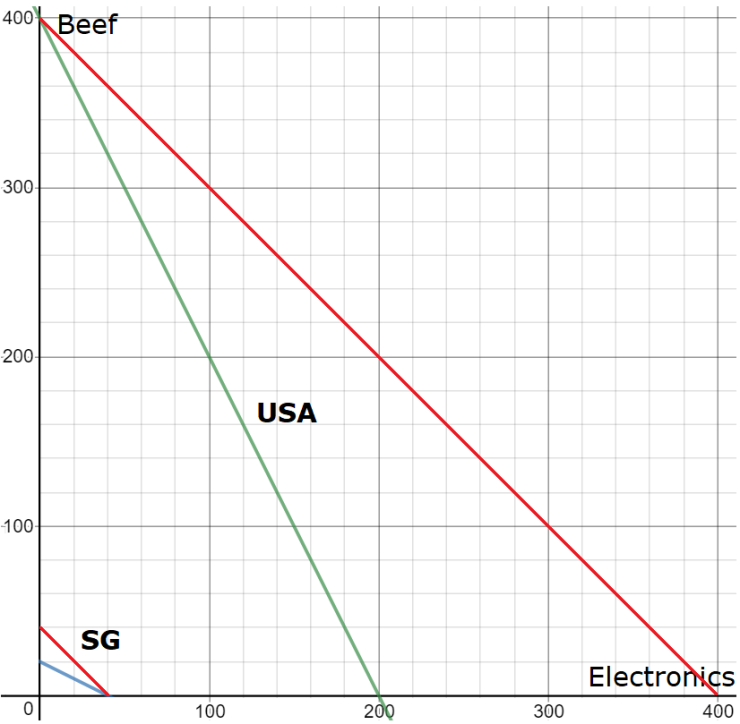
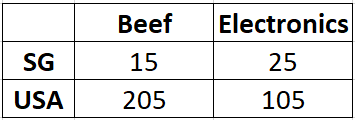
Singapore and USA are assumed to produce only 2 goods: Beef and Electronics.
And if each country had split their resources equally between producing both goods before trade, the respective goods’ quantity would be:
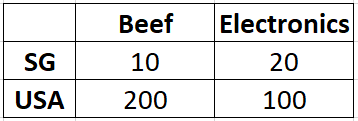
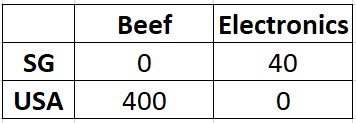
Singapore therefore has a comparative advantage in producing electronics, and the USA, in producing beef. With complete specialisation to produce at the lowest opportunity cost, the respective goods’ quantity would be:
To answer the question of how the terms of trade is determined, we can see that both USA and Singapore will find trade mutually beneficial as long as 1 beef is traded for x electronic, where 0.5 < x < 2.
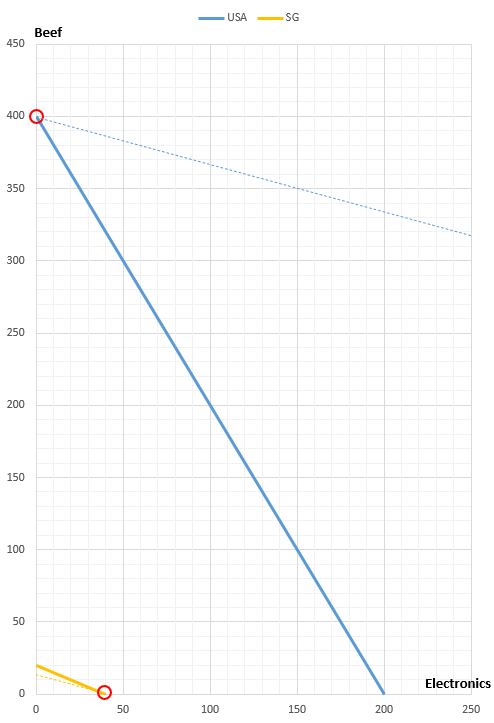
We can prove this by using 2 anti-examples where post-complete specialisation takes place (circled in red), and the terms of trade lie outside that stated range:
- Beef is traded for 0.2 electronic;
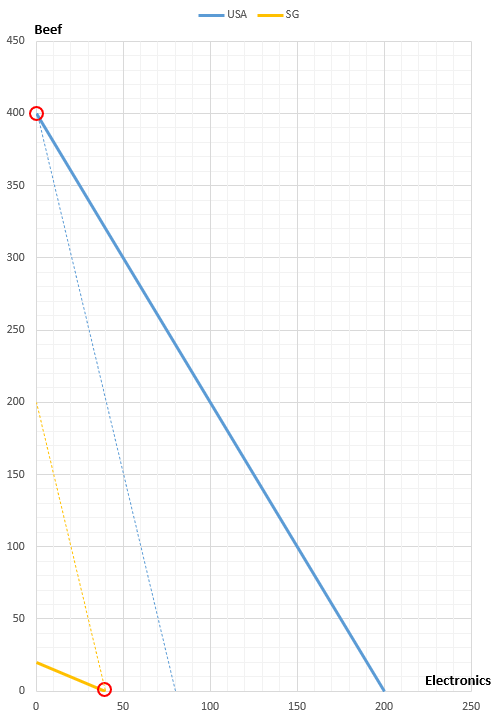
In this case, the consumption possibility has changed favourably for Singapore, but not for USA (respective dotted lines).
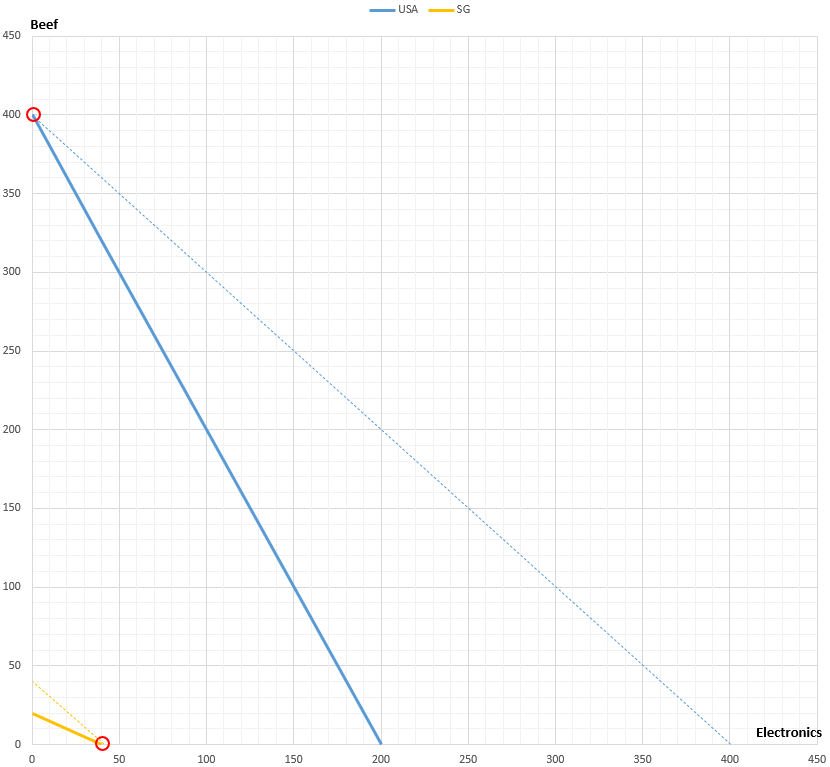
2. Beef is traded for 3 electronics
In this case, the consumption possibility has worsened for Singapore, but improved so drastically for USA that it went off-the-charts literally.
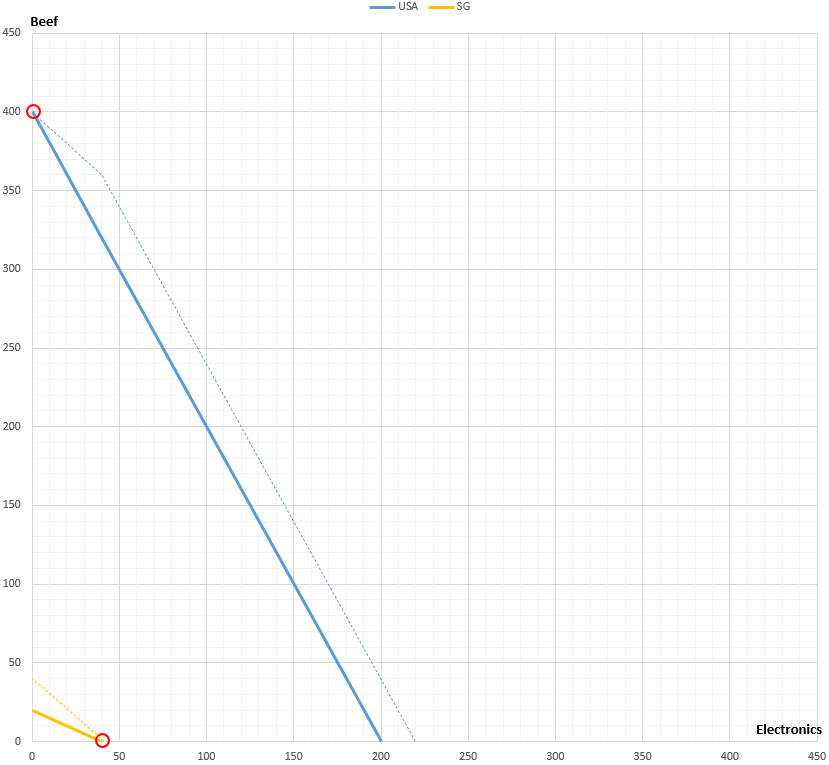
It can be concluded therefore that for mutual benefits to be realised, the gradient of the terms of trade must lie between those of the respective consumption possibilities, such as 1 beef : 1 electronic as illustrated below:
But Singapore is too small.
Since Singapore can only produce up to 40 units of electronics at most, the USA is therefore constrained to a maximum tradeable amount of 40 units of beef it produces.
Accordingly, with self-production of electronics past the 40 units received from Singapore, USA’s feasible consumption possibility looks like this rather:
Indisputable proof of mutual benefits.
The final piece of jigsaw puzzle lies with the determination of post-specialisation production and trade amounts.
To better the pre-trade production amounts as below in a strict sense, we should seek to produce and trade more of every type of good for both countries.
This is also where the graph proves useful in illustrating the possible post-trade production and trade that can fulfill our strict condition (corresponding shaded area for each country):
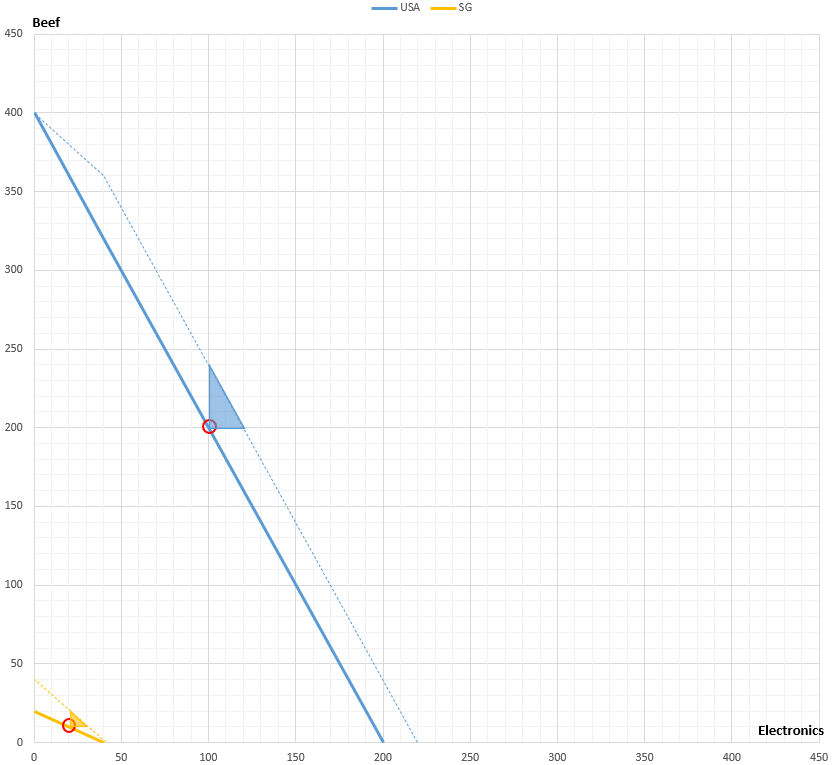
Returning to our previously proposed post-trade production and trade combination, we see that it lies within the respective shaded areas indeed:
One key fact stands out: The proposed production and trade combination for Singapore lies on its new consumption possibility frontier, indicating that it has indeed maximised the possible gains to trade. However this isn’t the case for USA, with the production and trade combination lying within the new consumption possibility frontier rather.
This isn’t particularly surprising since it is intuitive that a large country with a very sizeable absolute advantage in production for both types of goods will fail to achieve proportionate gains in trading with a much smaller country.
Nonetheless our proposed production and trade combination for both countries has achieved the stated aim of mutual benefits and that is good-enough proof that in theory at least, comparative advantage can indeed offer mutual incentives for both parties to trade.


Really enjoyed this blog post.Thanks Again. Really Great.
LikeLike