
This was actually a question posed to me over at the Ask Me section, but I felt my response merits a full-length post in its own right.
Question
My school taught us that for demerit goods, the MPC is below the MSC in the diagram. But I have seen model essays from books that showed that the MSB is below the MPB.
Which one should I apply in my exams?
Short Answer: It doesn’t matter.
Because both illustrations lead to the same results.
Although the analytical starting point differs superficially, they both share similar logic and therefore, outcomes.
Why? I will explain shortly, but fun fact first!
I might be able to guess your age.
*gasp*
Ok hear me out.
Older folks like myself (oops), were taught to use the MPB/MSB combination to illustrate the concept of demerit goods at “A” levels.
At some point later though, schools transitioned to using MPC/MSC combination to do the same.
So in theory, you could possibly tell someone’s age just by asking how to illustrate the concept of demerit goods!
Ok hyperbole aside, to see why both methodologies can be applied, let’s delve into the details.
The following sections assume that you already have a good grasp of what are MSB, MPB, MSC, MPC, MEB and MEC. If you don’t, you can read them up here.
Costs and benefits are different sides to the same coin.
A demerit good is one that imposes an external cost on consumption.
An external cost in turn refers to the cost imposed on an agent who is not directly involved in an economic transaction.
Because mathematically, we can quantify benefits as the polar opposite of costs:
- A positive cost is equivalent to a negative benefit of equal magnitude; and
- A positive benefit is equivalent to a negative cost of equal magnitude.
Given that:
- MSB = MPB + MEB
- MSC = MPC + MEC
We can technically re-write them as:
- MSB = MPB + (-MEC)
- MSC = MPC + (-MEB)
In other words, a demerit good can be correctly illustrated diagrammatically as either having a deviation between MSB, MPB or MSC, MPC.
Same-same therefore.
To further prove my point that both illustrations lead to the same outcomes, consider the diagrams below (labels with subscript 1 refer to socially-optimal levels, while labels with subscript 2 refer to actual levels):
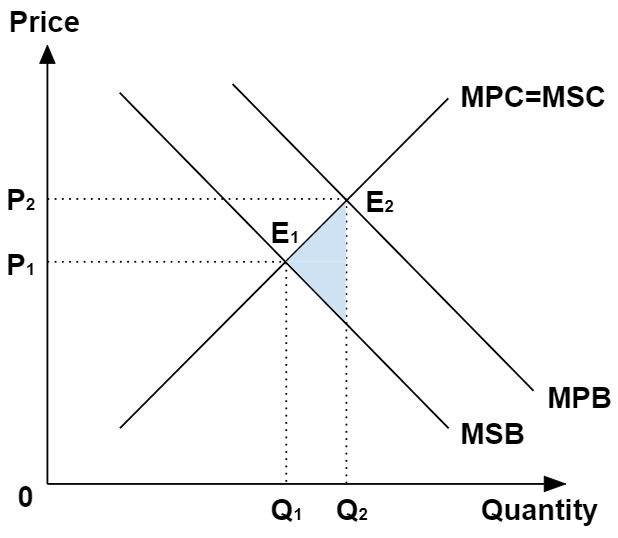
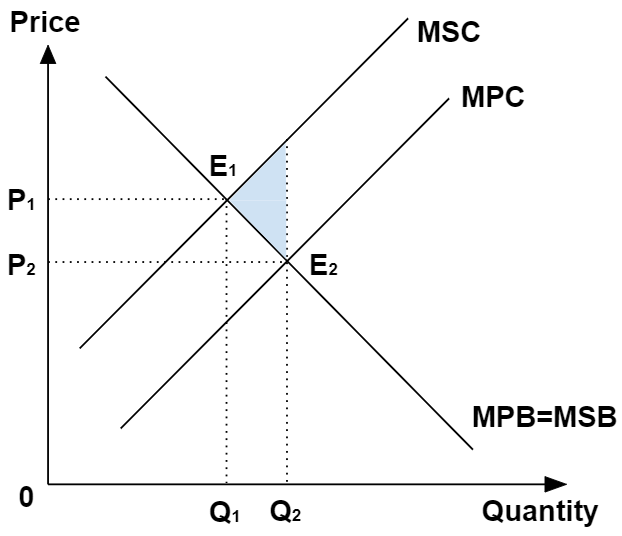
Noticed that both diagrams exhibit similar:
- Over-consumption levels (Q2 > Q1); and
- Dead-weight loss (shaded area)
One somewhat glaring difference between both diagrams is in the market price of the good, with the actual price being higher than the socially-optimal price in the first diagram, and vice versa in the second one.
However it doesn’t matter in explanations about demerit goods per se, because the defining characteristic of a demerit good (and other examples of negative externalities for the matter), is its over-production resulting in allocative inefficiency (i.e. dead-weight loss).
Don’t believe me? Read your school’s notes carefully!
Assumption alert
Note that the implicit assumption I had made in declaring that drawing either of both diagrams is acceptable, rests on the premise that the relative price elasticities between both supply and demand are the same.
This is because you will get different dead-weight loss outcomes between both cases if they differ in relative price elasticities between supply and demand.
How and why is beyond the scope of “A” level Economics, but you can prove that on your own by drawing and comparing both diagrams for either case of:
- Price inelastic demand, with price elastic supply; or
- Price elastic demand, with price inelastic supply.
Try it yourself!
Graph-drawing in “A” level Economics is of paramount importance in the exams.
Part of the required work to getting a good grade lies in practicing the graphical representations and accompanying explanations.
Don’t short-change yourself by not doing that!
A tried-and-tested rule of thumb to deciding your preferred approach is to follow the approach taught by your school. Of course, this assumes that the school gets it right, but it is probably a safe assumption because the alternative would be incredibly reprehensible.
So try it yourself, and as always, if you have a burning question, just ask me!


Itís difficult to find experienced people on this topic, however, you sound like you know what youíre talking about! Thanks
LikeLike